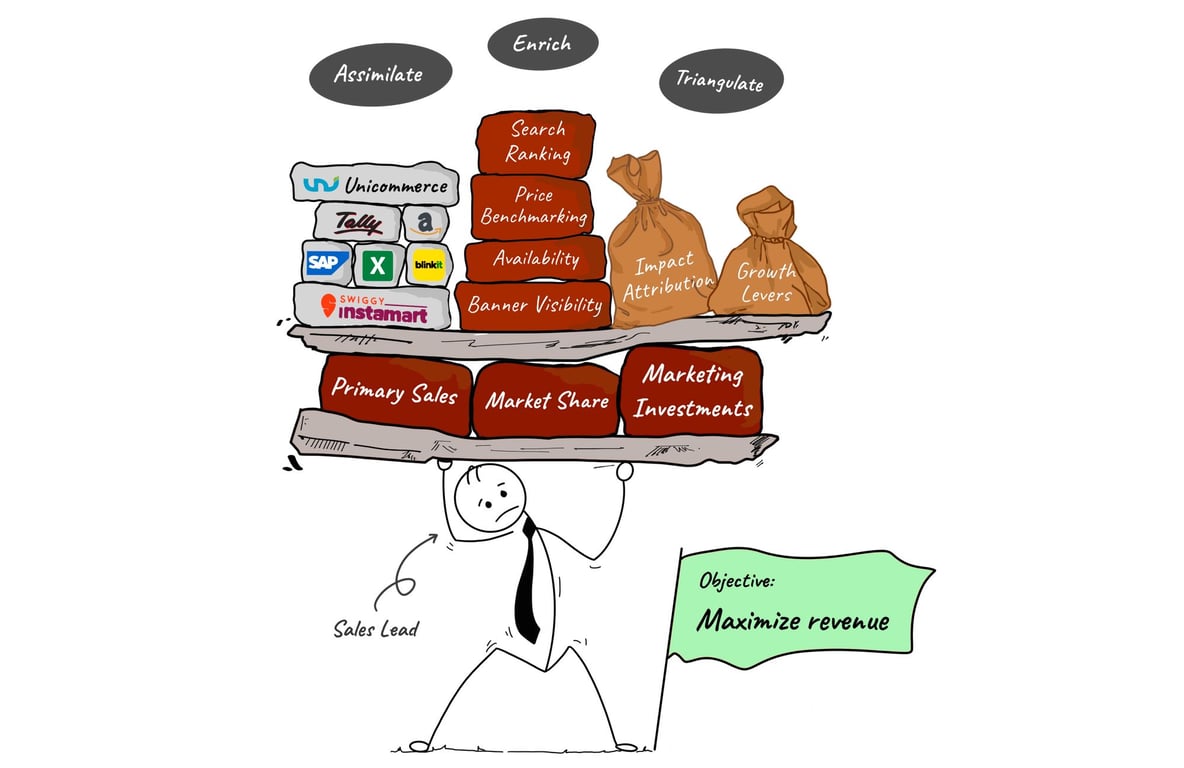
Revenue teams across brands strive for one overarching goal: maximizing revenue. The key levers that they have at their disposal are increasing primary sales, improving margins and minimizing excessive burn on marketing/discounting.
A very simple equation to contextualize this strategy is:
Revenue = Primary sales x (Margin - Marketing discount), where Marketing discount = Price discount + Visibility spends
However, managing revenue is more complex than this equation suggests.
When revenue teams experience changes in primary sales, be it an increase or decrease, their immediate response is to get to the root causes. These changes can be influenced by various factors such as shifts in secondary sales, the number of purchase orders raised by marketplace platforms, or the fill rates provided by brands to these purchase orders.
Challenges in assimilating data from various sources
In order to contextualize these different moving parts, revenue teams begin by collecting data from various sources like secondary sales and inventory data provided by marketplace platforms, PO and Invoice data sitting in their own finance and WMS systems etc. This leads to several issues like:
Diverse data sources: Brands operate on multiple platforms like Amazon, Flipkart, Blinkit, Zepto, Big Basket. Each of these platforms is at a different stage of evolution in terms of sharing data. As a result, there are diverse methods of data delivery—ranging from APIs and direct downloads to email attachments. Brands must grapple with this diversity to access their data efficiently.
Differing data formats: Even after aggregating data into a central repository, the data formats remain different. Each platform structures and presents data in its unique way, including things like SKU nomenclature, column names, and table structures.
For instance, consider a brand selling a product with the SKU Name - “Vanilla Energy bar 38 gm.” Amazon lists it as “Vanilla Energy bar,” Zepto as “Vanilla Energy bar 38 gm,” and Flipkart as “Vanilla Vegan energy bar.”
If the brand is analyzing sales data for this specific SKU, they might treat these listings as separate entities. Consequently, the sales for SKU Name "Vanilla Energy bar 38 gm" would only be attributed to Zepto, while other platforms would show zero sales. As a result, the brand struggles to accurately consolidate the data.
This is just an overly simplified example with three platforms and uni-dimensional inconsistency of a single SKU. In reality, the brand would be dealing with 8-10 platforms, 100s of SKUs, and numerous data discrepancies, making it challenging to establish a unified and cleaned view of sales data.
Data quality issues, like missing values and duplicate records, further complicate the process.
Mapping this diverse and scattered data into a standardized, easily understandable format is a mundane and time-consuming task that revenue teams need to invest in.
Data granularity: The level of data granularity varies across sources.
Few e-commerce platforms provide detailed data on customer interactions like impressions, clicks, click rate, cart adds, and purchases etc. Beyond sales data, some platforms also share more information on inventory levels, past POs raised etc.
Location level granularity also varies by platform, where some platforms provide data at the warehouse-level, others provide it at city-level. The reporting frequency also varies, with data being available on weekly or monthly timeframes.
Enriching data with additional attributes
When primary sales are influenced by changes in secondary sales, revenue teams need to double click into the key factors influencing the change in secondary sales. These could be things like marketing investments, availability, visibility, competitor pricing and many more.
For any brand, being on top of these factors is absolutely critical in order to figure out what to focus on. Unfortunately, very few if any of this data is shared by platforms with brands.
So in order to understand these factors, brands often need to rely on third-party tools for additional data. However, this creates another challenge in setting up data scraping processes and integrating the data with existing sales and inventory data. This triggers an entire assimilation process all over for them.
Triangulating data for revenue RCA
Once all the data is collected and enriched, revenue teams must triangulate the data to understand its impact on sales, cost, and revenue.
Revenue teams end up spending hours establishing relationships among these variables to uncover root causes of revenue fluctuations.
In the absence of quick and clear insights from the extensive data at their disposal, revenue teams often use discounting as a lever when better alternatives might exist.
So, how are these challenges currently addressed?
Currently, brands try to hire a team of data analysts and hope they will be able to solve all these problems for them. Gradually, they realize that this is not a one-person job, and they need to invest in data engineering and master data management capabilities, to enable collection, cleaning, and assimilation of data across sources.
This is a time consuming and expensive process starting from the understanding of the right skill-sets to look for to hiring that right resource.
If and when the hiring does happen, there is a time gap before brands can start extracting some value off this investment. Also, there is very little amortization of this investment as pretty much every brand would need to invest in the same capabilities to solve the same problems.
Is there a better way?
A better way to handle these challenges is to leverage a solution like GobbleCube that is purpose-built for brands to run their revenue. GobbleCube streamlines the process end-to-end for revenue teams through:
Data assimilation: GobbleCube helps brands organize their scattered data.
Translation layer: It enables seamless communication between different data sources.
Data enrichment: GobbleCube enhances data with information like availability, price comparisons, and marketing expenditures.
Attribution frameworks: It connects impact to its causes, providing context.
User-friendly visualization: GobbleCube offers an elegant interface for easy team collaboration and action.
Why is this a better approach?
Reduced overhead: Revenue teams can avoid the complexity of building and maintaining data pipelines by relying on GobbleCube.
Faster time to value: GobbleCube abstracts the entire process from assimilation, enrichment, triangulation, and visualization, allowing revenue teams to focus on taking action.
Peace of mind: GobbleCube automatically handles changes in source data, ensuring data accuracy and consistency.
If you’re interested in exploring these possibilities, please reach out. We’d be happy to chat!
From $0 to $2M ARR, GobbleCube is redefining how brands scale—turning data into growth with real-time intelligence, automation, and AI-powered ad tools.