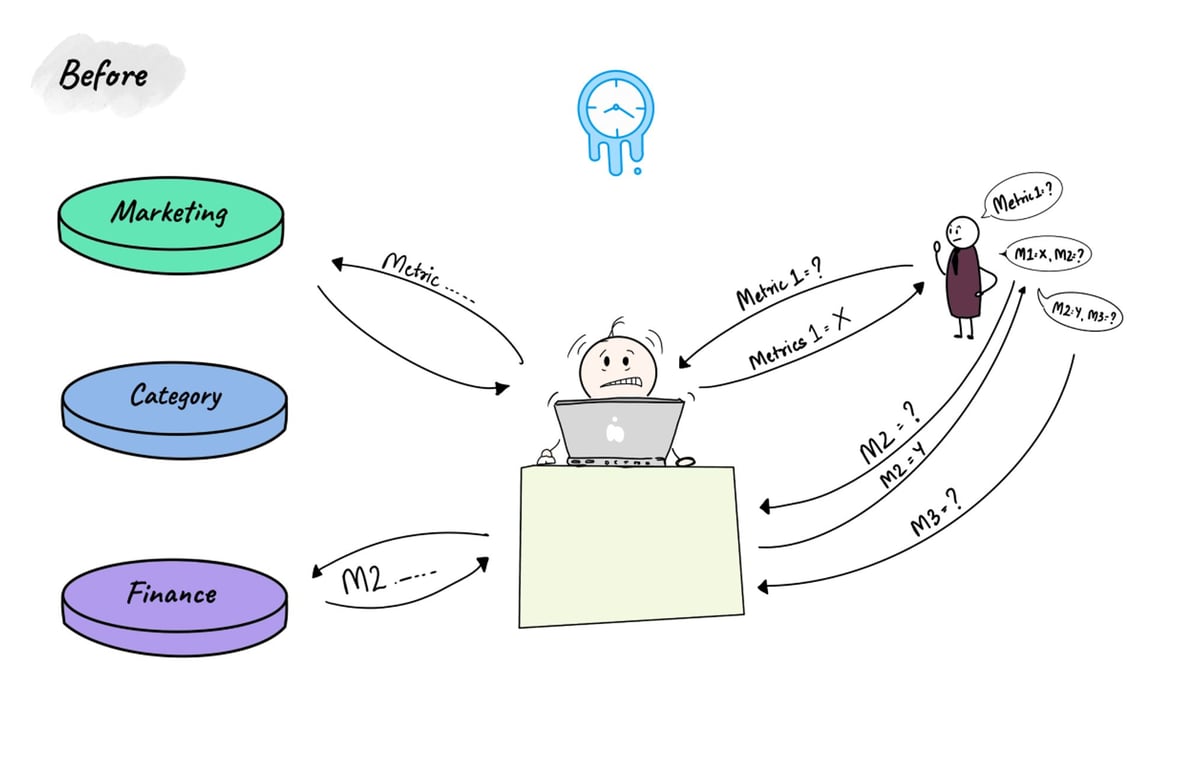
“I approach the monthly business review meeting with meticulous preparation and pre-calculated data to discuss channel sales and strategies. However, the meeting takes an unexpected turn when a discrepancy arises in data I'm referring to and that of a colleague from a different department. Our focus suddenly shifts to reconciling these conflicting numbers. As I wait for SQLs on the dashboard to finish and load the requested data,1… 2… 3…each passing second feels like an eternity, with other folks in the room impatiently looking at me.
Unfortunately, despite our efforts, the strategy discussion gets sidelined as we grapple with reconciling data. The meeting concludes without any outcome, leaving us to continue seeking the right numbers until the next one.”
This anecdote isn't unique to a single individual or organization; it's a recurring challenge for countless businesses.
From my experience as a data practitioner and conversations with decision-makers, I've observed these common struggles:
Lack of consistency in business metrics’ calculations, leading to conflicting numbers across various teams, and
Painfully slow business dashboards
These issues are the result of archaic data management practices and tools that fail to keep pace with evolving business needs.
Data unable to serve the business needs
The expectation with data is that of an enabler for growth, yet too often, it becomes a bottleneck. This occurs because the evolution of data requirements has outpaced the upgrades in the underlying data tools. As data usage proliferates across business users within the org, certain limitations become evident:
Divergent ways of calculating metrics: Individuals across different teams may write their own code for metrics calculation and to power their visualization layer. This leads to the possibility of having multiple/divergent definitions for the calculation of the same metric and hence the problem of inconsistent numbers.
For example, when multiple teams track Purchase Orders using different tools, they invariably have challenges reconciling their numbers and spend a significant time just ironing out those discrepancies.
Evenif these methodologies/calculations are documented somewhere, SQL (or any other coding method) has a tendency to go out of sync from documentation over time. The base problem lies in duplicating the same logic across multiple tools. Until there is a single place for metric calculations, inconsistent numbers are bound to be there. The reconciliation should happen at a single place instead of passing on that headache to the business.
Getting to the right data is painfully slow: When business people need to validate their hypotheses or chain-of-thought with data, it almost never completes because each step in the chain of fetching data is painfully slow, to the point of flipping out.
To avoid slowness/latency, various tools use caching. However, with each tool using their own cache means duplicated developer effort and the associated maintenance issues.
We've encountered this pain point with multiple clients, highlighting that this is not a one-off but a more systemic issue.
Cube, to the rescue
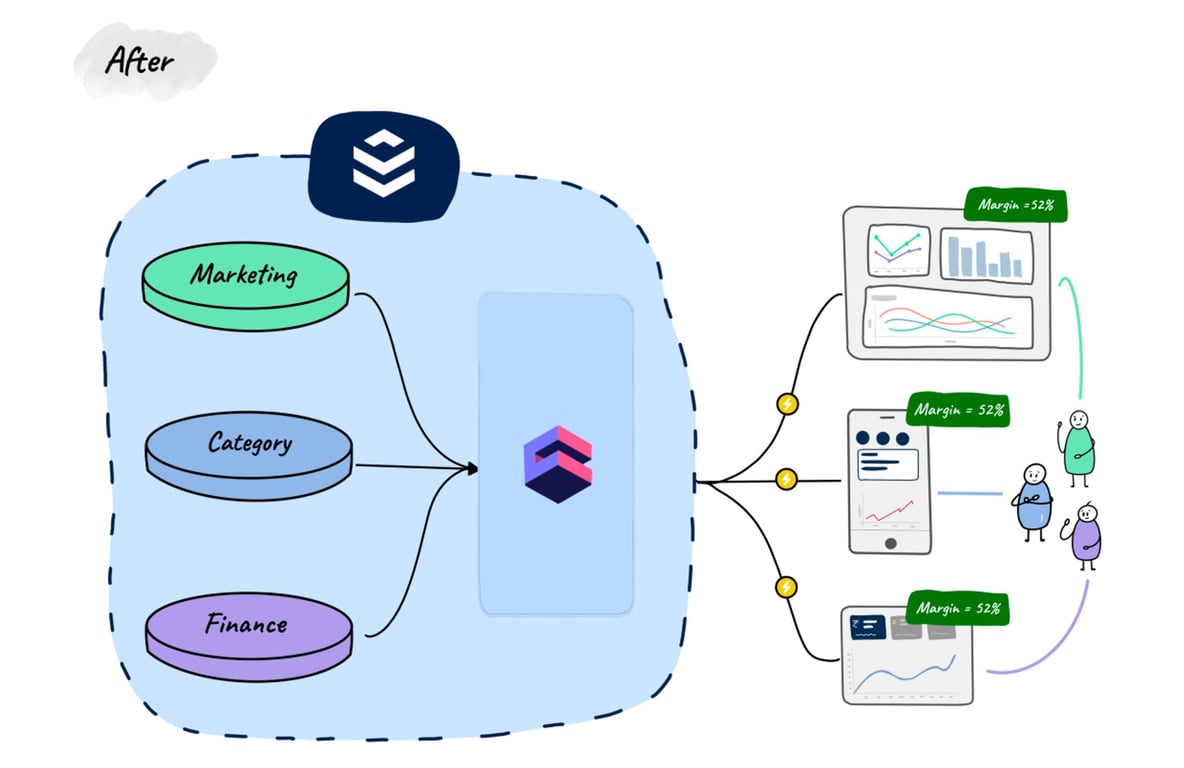
In response to these challenges, we started looking out for solutions and zeroed in on Cube for one of our top FMCG clients. Cube is an open-source offering aiming to solve the problems we just mentioned. It works on the concept of building a universal semantic layer between the data sources and data application/visualization layer.
How Cube solves the challenges
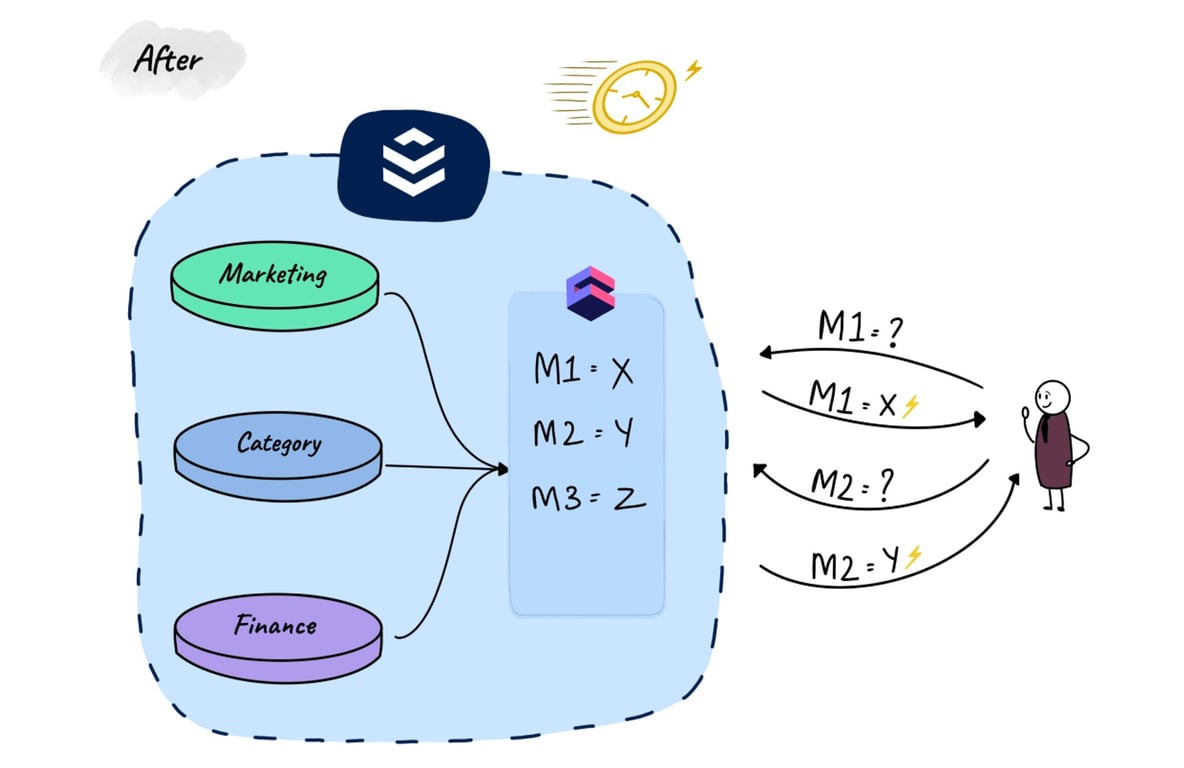
Centralized business metrics definitions with data modeling
Cube helps establish a centralized repository for all business metric definitions. With data-modeling solved in a single place, the problem of inconsistent numbers and tedious reconciliations have become a thing of the past.
Pre-Cube Dilemma: Our Client noted that they previously spent roughly 30% of their time in all business meetings just to confirm and reconcile the numbers.
Cube-Driven Impact: However, after implementing Cube, that time dropped to zero. This represents a significant saving for the business, as top business leaders can now allocate their time more strategically.
The happiness of completing those chain-of-thoughts
Cube provides an in-built caching and pre-aggregation layer, making it easy to provide blazingly fast access to the required analytics data (we are talking ~100 milli-seconds latency here). The pre-aggregations eliminate the need for on-the-fly calculations during query execution.
Pre-Cube Dilemma: Prior to using Cube, queries hit the data warehouse and took a few minutes to execute.
Cube-Driven Impact: After we rolled out Cube and hyper-linked various data-points, this time was reduced to less than 1 second!!
Our client mentioned, “Our business teams have become more self-reliant. Their hypotheses are reaching completion, and their chain-of-thoughts remain uninterrupted due to slowness of data-retrieval. They now get answers to business problems swiftly, leading to more confident decision-making.”
Our devs love it
Cube provides multiple interfaces for fetching data. Whether we are powering a BI tool’s visualization or a custom frontend through APIs, Cube provides comprehensive coverage with REST API, GraphQL and SQL-protocol interfaces.
Pre-Cube Dilemma: Earlier, our devs spent approximately 10% of their time writing and maintaining these multiple interfaces.
Cube-Driven Impact: However, after using Cube, this time dropped to zero! This means our devs could focus on solving real business problems instead of grappling with the same ones over and over again.
🛠
Under the hood technology
For the engineer in you, below are the underlying details of how we achieved these things in Cube.
1. Defining Cubes: The core to any data access through Cube is by defining a cube in a JS/YAML file. Multiple cubes can be defined and joined together like in SQL, but with the limitation that only LEFT JOIN is allowed (at the time of writing this).
2. Defining Pre-aggregations: Determine the grain at which the data is required by business users and define the pre-aggreations, putting relevant dimensions, metrics, and time granularity. This ensures that the data retrieval is blazingly fast.
3. Access your data either through the SQL interface to power any BI tool or REST/GraphQL APIs. Cube ensures that numbers retrieved through all these interfaces are consistent.
The implementation of Cube has transformed the way our client operates and does day-to-day business problem solving and analysis.
Time that was once spent reconciling conflicting data points is now redirected toward strategic initiatives. This newfound efficiency has empowered their teams to make data-driven decisions with unprecedented speed and confidence. In their words, getting to data now “feels like magic!”
If your business is struggling with similar data challenges, feel free to reach out. We would love to share our experiences and help you overcome your data headaches.